Auto Facial Animation - Saccade
The Saccade node corresponds to the "EyeLook" morph from the default facial morphs for CC3+ characters.
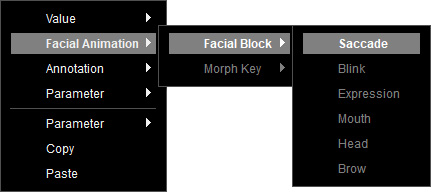
To create a Saccade node, right-click on the empty area of the graph, and select Facial Animation > Facial Block > Saccade from the context menu.
You can adjust the frequency, strength, speed, vertical / horizontal scale, and preset curve via the Value nodes to control the animation results.
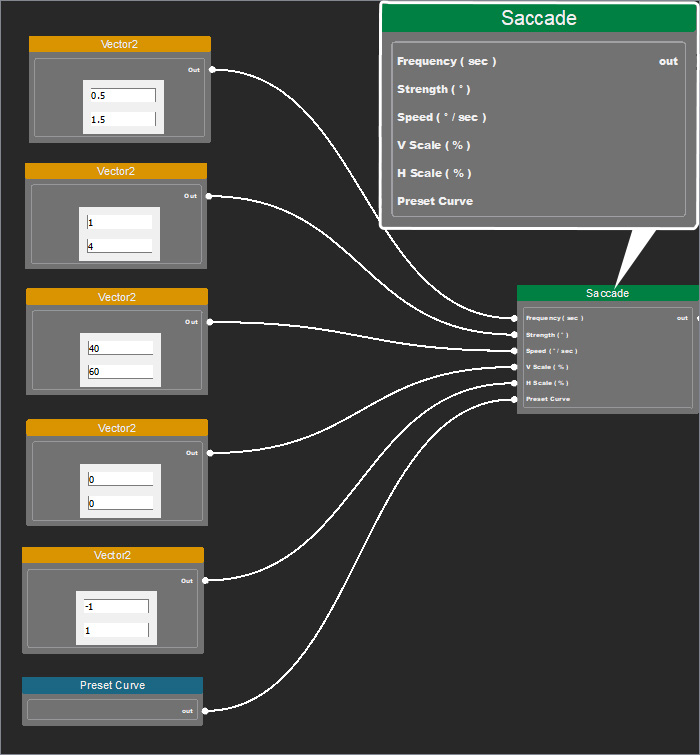
 Frequency
Defines the time interval between each eye dart motion.
It accepts values input from the Vector2 node.
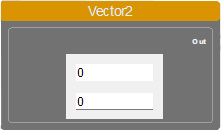
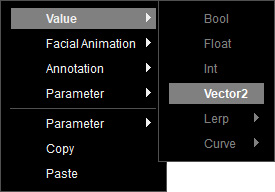
To create a Vector2 node, right-click on the empty area of the graph, and select Value > Vector2 from the context menu.
Specify the value range by defining a low and high value (in seconds) in the node.
For example, if the range is 2 to 4 seconds, each eye-look animation will randomly pick a time interval between 2 and 4 seconds (e.g., 2.83 sec) for the next eye movement.
Connect the Vector2 node to the Frequency input of the Saccade node.
To create a Vector2 node, right-click on the empty area of the graph, and select Value > Vector2 from the context menu.
Specify the value range by defining a low and high value (in seconds) in the node.
For example, if the range is 2 to 4 seconds, each eye-look animation will randomly pick a time interval between 2 and 4 seconds (e.g., 2.83 sec) for the next eye movement.
Connect the Vector2 node to the Frequency input of the Saccade node.
Strength
Defines the angle required for each eye-look animation from the current position to a new target position.
It accepts values input from the Vector2 node.
To create a Vector2 node, right-click on the empty area of the graph, and select Value > Vector2 from the context menu.
Specify the value range by defining a low and high value (in degrees) in the node, and use the negative values to represent "up" and "left", while the positive values to represent "down" and "right".
For example, if the range is 50 to 100 degrees, each eye-look animation will randomly pick a value within 50 to 100 degrees as the eye rotation angle for the next animation.
Connect the Vector2 node to the Strength input of the Saccade node.
To create a Vector2 node, right-click on the empty area of the graph, and select Value > Vector2 from the context menu.
Specify the value range by defining a low and high value (in degrees) in the node, and use the negative values to represent "up" and "left", while the positive values to represent "down" and "right".
For example, if the range is 50 to 100 degrees, each eye-look animation will randomly pick a value within 50 to 100 degrees as the eye rotation angle for the next animation.
Connect the Vector2 node to the Strength input of the Saccade node.
Speed
Defines the rotation speed for each eye-look animation.
It accepts values input from the Vector2 node.
To create a Vector2 node, right-click on the empty area of the graph, and select Value > Vector2 from the context menu.
Specify the value range by defining a low and high value (in degrees per second) in the node.
For example, if the range is 10 to 30, each eye-look animation will randomly pick a value within 10 to 30°/sec as the eye rotation speed until the target intensity is reached.
Connect the Vector2 node to the Speed input of the Saccade node.
To create a Vector2 node, right-click on the empty area of the graph, and select Value > Vector2 from the context menu.
Specify the value range by defining a low and high value (in degrees per second) in the node.
For example, if the range is 10 to 30, each eye-look animation will randomly pick a value within 10 to 30°/sec as the eye rotation speed until the target intensity is reached.
Connect the Vector2 node to the Speed input of the Saccade node.
Vertical Scale
Multiplied by the Strength value, this setting defines the random range for each saccade movement's final strength in the vertical direction.
The possibility of simultaneous up-down occurring will be excluded automatically.
It accepts values input from the Vector2 node.
To create a Vector2 node, right-click on the empty area of the graph, and select Value > Vector2 from the context menu.
Specify the value range by defining a low and high value (in percentages) in the node.
For example, if the strength ranges between 3° and 15°, and the vertical range is set to 0.5 to 0.5, the final result for the vertical direction will be randomly chosen between 1.5° upward and 7.5° downward.
Connect the Vector2 node to the Vertical Scale input of the Saccade node.
To create a Vector2 node, right-click on the empty area of the graph, and select Value > Vector2 from the context menu.
Specify the value range by defining a low and high value (in percentages) in the node.
For example, if the strength ranges between 3° and 15°, and the vertical range is set to 0.5 to 0.5, the final result for the vertical direction will be randomly chosen between 1.5° upward and 7.5° downward.
Connect the Vector2 node to the Vertical Scale input of the Saccade node.
Horizontal Scale
Multiplied by the Strength value, this setting defines the random range for each saccade movement's final strength in the horizontal direction.
The possibility of simultaneous left-right occurring will be excluded automatically.
It accepts values input from the Vector2 node.
To create a Vector2 node, right-click on the empty area of the graph, and select Value > Vector2 from the context menu.
Specify the value range by defining a low and high value (in percentages) in the node.
For example, if the strength ranges between 3° and 15°, and the horizontal range is set to 0.5 to 0.5, the final result for the vertical direction will be randomly chosen between 1.5° left and 7.5° right.
Connect the Vector2 node to the Horizontal Scale input of the Saccade node.
To create a Vector2 node, right-click on the empty area of the graph, and select Value > Vector2 from the context menu.
Specify the value range by defining a low and high value (in percentages) in the node.
For example, if the strength ranges between 3° and 15°, and the horizontal range is set to 0.5 to 0.5, the final result for the vertical direction will be randomly chosen between 1.5° left and 7.5° right.
Connect the Vector2 node to the Horizontal Scale input of the Saccade node.
Preset Curve
Defines the transition behavior when animating from the current value to a target value.
The animation dynamically adjusts its motion intensity and timing while maintaining a curve-based behavior.
It accepts a preset animation curve from the Preset Curve node.
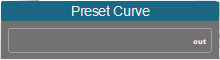
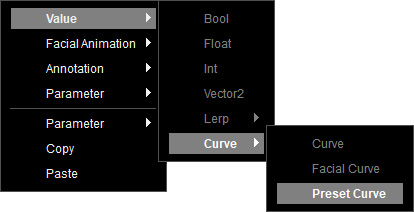
To create a Preset Curve node, right-click on the empty area of the graph, and select Value > Curve > Preset Curve from the context menu.
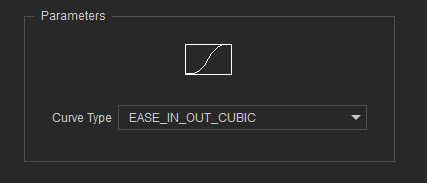
Select this node, and choose a curve type from the drop-down list in the Parameters section.
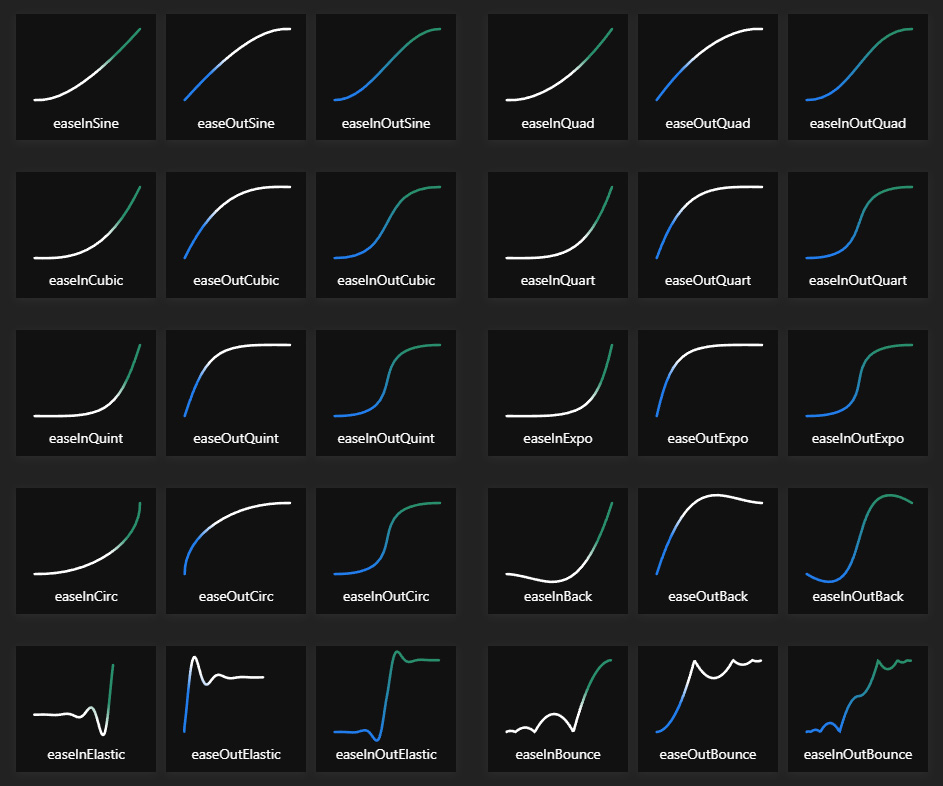
You can visit the website for more details on easing styles.
Connect the Preset Curve node to the Preset Curve input of the Saccade node.
To create a Preset Curve node, right-click on the empty area of the graph, and select Value > Curve > Preset Curve from the context menu.
Select this node, and choose a curve type from the drop-down list in the Parameters section.
You can visit the website for more details on easing styles.
Connect the Preset Curve node to the Preset Curve input of the Saccade node.
Using Lerp
In additional to the values input from Vector2, you can use Lerp to design the range of random animations.
The Lerp (linear Interpolate) is a mathematical operation node to find an interpolated value between two inputs.
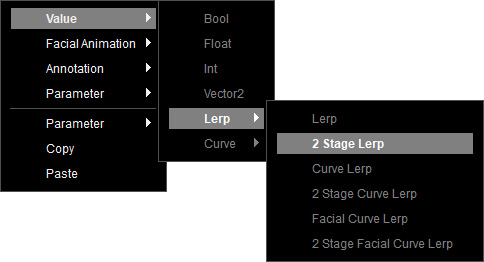
For example, create a 2 Stage Lerp node from the context menu Value > Lerp > 2 Stage Lerp to control the saccade frequency.
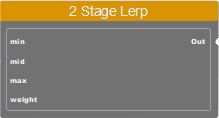
The 2 Stage Lerp node provides 3 input ports: min, mid and max for three different ranges, input from the Float or Vector2 node.
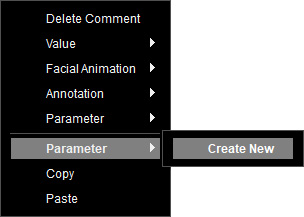
It requires a parameter node to control the weight for output. You can create one by right-clicking on the empty area of the graph, and selecting Parameter > Create New from the context menu.
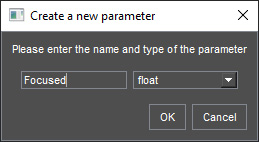
Name the new parameter and choose the float type. Click on OK.
Select this node to set a value ranging from 0 to 1 in the Variables section, to perform linear interpolation between the values from min to max. Once executed, the interpolated result is computed and sent to the connected nodes.
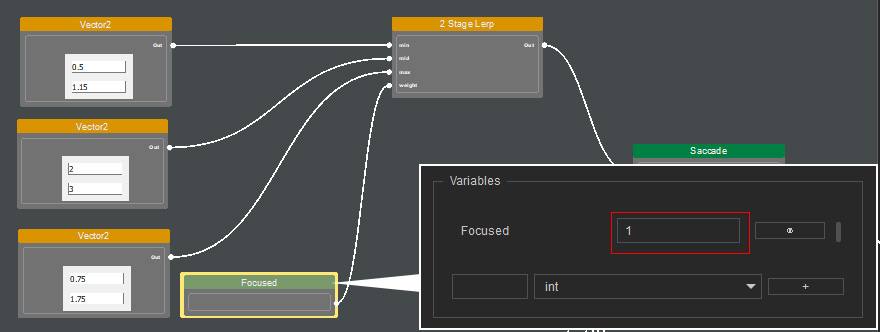
For example, create a 2 Stage Lerp node from the context menu Value > Lerp > 2 Stage Lerp to control the saccade frequency.
The 2 Stage Lerp node provides 3 input ports: min, mid and max for three different ranges, input from the Float or Vector2 node.
It requires a parameter node to control the weight for output. You can create one by right-clicking on the empty area of the graph, and selecting Parameter > Create New from the context menu.
Name the new parameter and choose the float type. Click on OK.
Select this node to set a value ranging from 0 to 1 in the Variables section, to perform linear interpolation between the values from min to max. Once executed, the interpolated result is computed and sent to the connected nodes.
- If the value is set to 0, the result equals min.
- If the value is set to 0.5, the result equals mid.
- If the value is set to 1, the result equals max.
Make sure that the data are properly input in the Value nodes, before linking the Saccade node to the root Auto Facial Animation node.
