Driven Animation Sources - Brow
The Brow node calculates procedural brow animation based on the received values. It then outputs the result to an animation trigger.
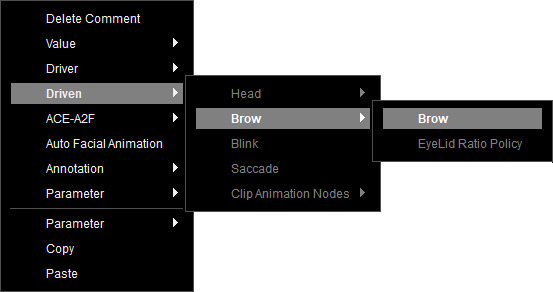
To create a Brow node, right-click on the empty area of the graph, and select Driven > Brow > Brow from the context menu.
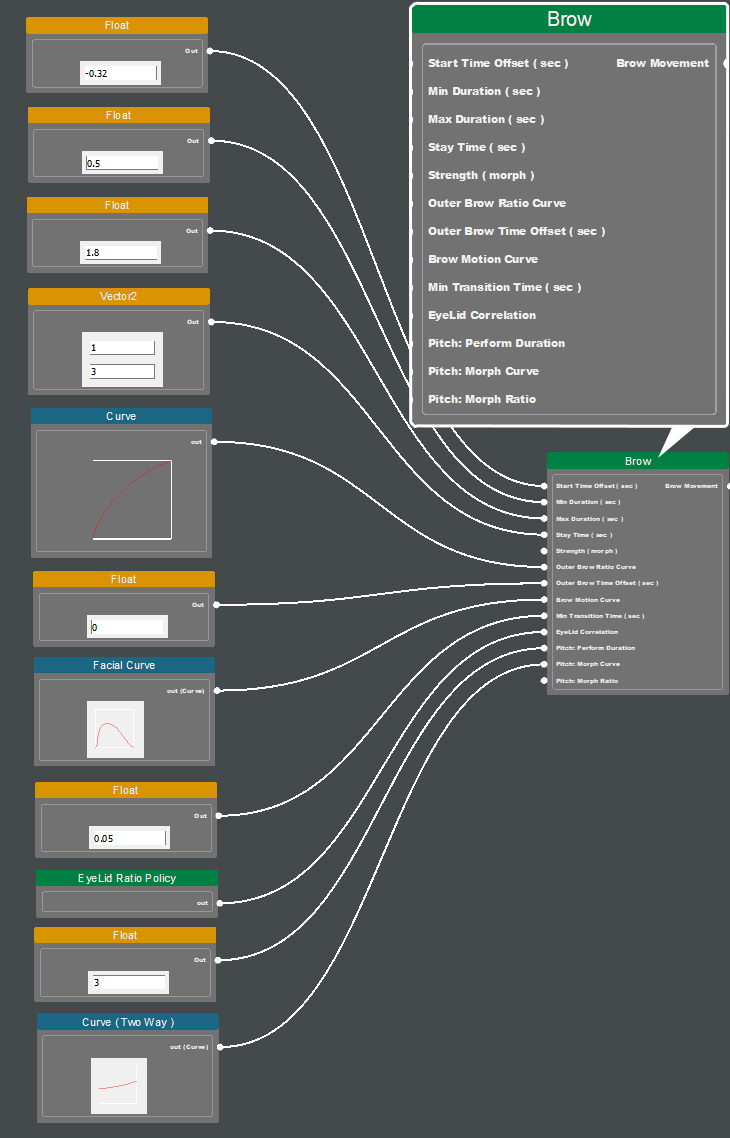
Value nodes can be fed into the various Brow inputs to control the animation.
 Start Time Offset
Defines the time offset before or after triggering a brow raise or lower animation.
It accepts values from the Float node.
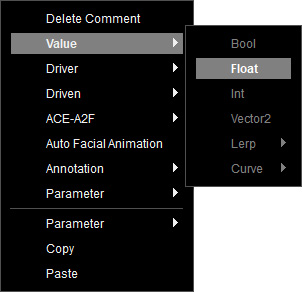
To create a Float node, right-click on the empty area of the graph, and select Value > Float from the context menu.
Set a numeric value (in seconds) up to 2 decimal places in precision. Upon execution, the configured value will be transmitted to connected nodes.
Connect the Float node to the Start Time Offset input of the Brow node.
To create a Float node, right-click on the empty area of the graph, and select Value > Float from the context menu.
Set a numeric value (in seconds) up to 2 decimal places in precision. Upon execution, the configured value will be transmitted to connected nodes.
Connect the Float node to the Start Time Offset input of the Brow node.
Min Duration
Defines the minimum time range for each brow motion.
It accepts values from the Vector2 node.
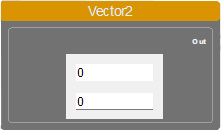
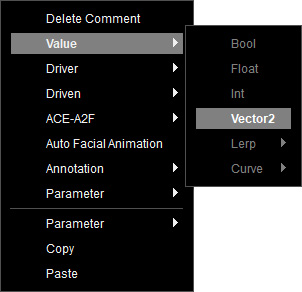
To create a Vector2 node, right-click on the empty area of the graph, and select Value > Vector2 from the context menu.
Specify the value range by defining a low and high value (in seconds) in the node. This node accepts two numerical inputs and generates a random value within the defined range. Once executed, it transmits the randomly selected result to the connected node.
Connect the Vector2 node to the Min Duration input of the Brow node.
To create a Vector2 node, right-click on the empty area of the graph, and select Value > Vector2 from the context menu.
Specify the value range by defining a low and high value (in seconds) in the node. This node accepts two numerical inputs and generates a random value within the defined range. Once executed, it transmits the randomly selected result to the connected node.
Connect the Vector2 node to the Min Duration input of the Brow node.
Max Duration
Defines the maximum time range for each brow motion.
It accepts values from the Vector2 node.
To create a Vector2 node, right-click on the empty area of the graph, and select Value > Vector2 from the context menu.
Specify the value range by defining a low and high value (in seconds) in the node. This node accepts two numerical inputs and generates a random value within the defined range. Once executed, it transmits the randomly selected result to the connected node.
Connect the Vector2 node to the Max Duration input of the Brow node.
To create a Vector2 node, right-click on the empty area of the graph, and select Value > Vector2 from the context menu.
Specify the value range by defining a low and high value (in seconds) in the node. This node accepts two numerical inputs and generates a random value within the defined range. Once executed, it transmits the randomly selected result to the connected node.
Connect the Vector2 node to the Max Duration input of the Brow node.
Stay Time
Defines the time range to hold the result after completing a brow raise or lower.
It accepts values from the Vector2 node.
A random value is selected within the defined range.
To create a Vector2 node, right-click on the empty area of the graph, and select Value > Vector2 from the context menu.
Specify the value range by defining a low and high value (in seconds) in the node. This node accepts two numerical inputs and generates a random value within the defined range. Once executed, it transmits the randomly selected result to the connected node.
Connect the Vector2 node to the Stay Time input of the Brow node.
To create a Vector2 node, right-click on the empty area of the graph, and select Value > Vector2 from the context menu.
Specify the value range by defining a low and high value (in seconds) in the node. This node accepts two numerical inputs and generates a random value within the defined range. Once executed, it transmits the randomly selected result to the connected node.
Connect the Vector2 node to the Stay Time input of the Brow node.
Strength
Determines the target intensity range for brow movement.
It accepts values from the Vector2 node.
To create a Vector2 node, right-click on the empty area of the graph, and select Value > Vector2 from the context menu.
Specify the value range by defining a low and high value (for morph) in the node, and use the positive values to represent raising brows, while the negative values to represent lowering brows. This node accepts two numerical inputs and generates a random value within the defined range. Once executed, it transmits the randomly selected result to the connected node.
Connect the Vector2 node to the Strength input of the Brow node.
To create a Vector2 node, right-click on the empty area of the graph, and select Value > Vector2 from the context menu.
Specify the value range by defining a low and high value (for morph) in the node, and use the positive values to represent raising brows, while the negative values to represent lowering brows. This node accepts two numerical inputs and generates a random value within the defined range. Once executed, it transmits the randomly selected result to the connected node.
Connect the Vector2 node to the Strength input of the Brow node.
Outer Brow Ratio Curve
Defines the strength ratio between inner and outer brows using a single-quadrant non-linear curve.
If unset, inner and outer brows have equal strength.
It accepts a custom animation curve from the Curve node.
The x-axis stands for the strength of inner brow, while the y-axis stands for the strength of outer brow.
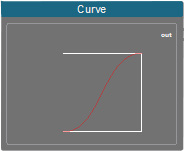
* This setting only applies to "Brow Raise". As for CC3+ character models, "Brow Drop" does not differentiate between inner and outer brows.
To create a Curve node, right-click on the empty area of the graph, and select Value > Curve > Curve from the context menu.
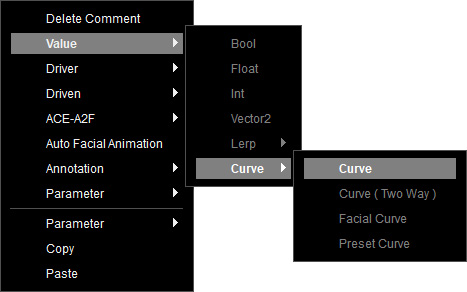
Select this node, and drag the Bezier curve to define X and Y values in the Parameters section.
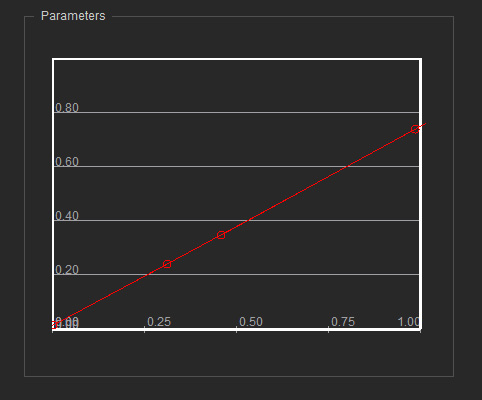
For example, if the X set to 1 and Y set to 0.75, and when the inner brow strength reaches 70, the outer brow will raise with 52.5 intensity.
Connect the Curve node to the Outer Brow Ratio Curve input of the Brow node.
* This setting only applies to "Brow Raise". As for CC3+ character models, "Brow Drop" does not differentiate between inner and outer brows.
To create a Curve node, right-click on the empty area of the graph, and select Value > Curve > Curve from the context menu.
Select this node, and drag the Bezier curve to define X and Y values in the Parameters section.
For example, if the X set to 1 and Y set to 0.75, and when the inner brow strength reaches 70, the outer brow will raise with 52.5 intensity.
Connect the Curve node to the Outer Brow Ratio Curve input of the Brow node.
Outer Brow Time Offset
Determines the timing difference between outer and inner brow movements.
Positive value lets the outer brows start earlier, while negative value starts later.
It accepts values from the Float node.
To create a Float node, right-click on the empty area of the graph, and select Value > Float from the context menu.
Set a numeric value (in seconds) up to 2 decimal places in precision, and use the positive values to represent outer brow starts earlier, while the negative values to represent outer brow starts later. Upon execution, the configured value will be transmitted to connected nodes.
Connect the Float node to the Outer Brow Time Offset input of the Brow node.
To create a Float node, right-click on the empty area of the graph, and select Value > Float from the context menu.
Set a numeric value (in seconds) up to 2 decimal places in precision, and use the positive values to represent outer brow starts earlier, while the negative values to represent outer brow starts later. Upon execution, the configured value will be transmitted to connected nodes.
Connect the Float node to the Outer Brow Time Offset input of the Brow node.
Brow Motion Curve
Defines the animation curve followed during each brow motion.
It accepts an animation curve from the Facial Curve node.
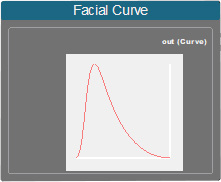
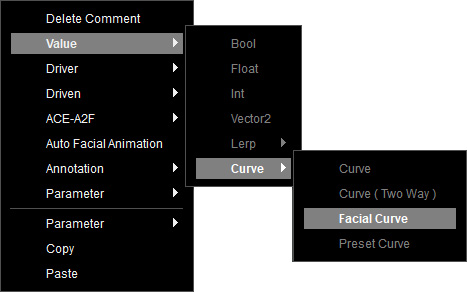
To create a Facial Curve node, right-click on the empty area of the graph, and select Value > Curve > Facial Curve from the context menu.
Select this node, and drag the Bezier curve along the X and Y axes in the Parameters section.
Connect the Facial Curve node to the Brow Motion Curve input of the Brow node.
To create a Facial Curve node, right-click on the empty area of the graph, and select Value > Curve > Facial Curve from the context menu.
Select this node, and drag the Bezier curve along the X and Y axes in the Parameters section.
- X Axis for Time Distribution: Defines the time distribution of lowering and raising brows based on the result from Duration range.
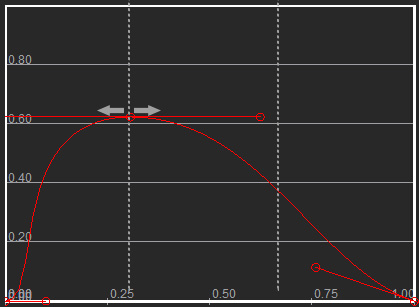
For example, if the total brow duration is 2 seconds, and the curve's lowering-to-raising ratio is 1:2, the lowering time will be 0.66 seconds, and the raising time will be 1.33 seconds. - Y Axis for Peak Strength Adjustment: Multiplies the result from Strength range with the curve’s peak value to determine the final brow intensity.
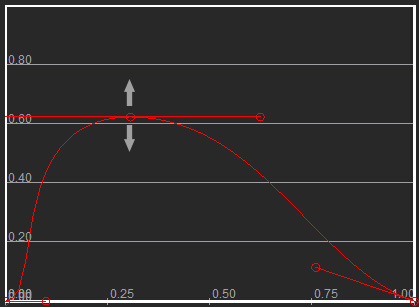
For example, If the brow intensity percentage is 0.8 (80%), and the curve peak value is 0.6, the final brow intensity will be 0.48 (48%).
Connect the Facial Curve node to the Brow Motion Curve input of the Brow node.
Min Transition Time
Determines the minimum interval allowed before a new brow movement can occur during an ongoing one.
It accepts values from the Float node.
To create a Float node, right-click on the empty area of the graph, and select Value > Float from the context menu.
Set a numeric value (in seconds) up to 2 decimal places in precision. Upon execution, the configured value will be transmitted to connected nodes.
For example, if set to 1 sec, a raise cannot occur within the first second of a lower animation.
Connect the Float node to the Min Transition Time input of the Brow node.
To create a Float node, right-click on the empty area of the graph, and select Value > Float from the context menu.
Set a numeric value (in seconds) up to 2 decimal places in precision. Upon execution, the configured value will be transmitted to connected nodes.
For example, if set to 1 sec, a raise cannot occur within the first second of a lower animation.
Connect the Float node to the Min Transition Time input of the Brow node.
EyeLid Correlation
Determines how much the eyelids move with brow motion by connecting to a Eyelid Ratio Policy node.
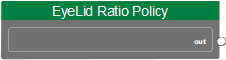
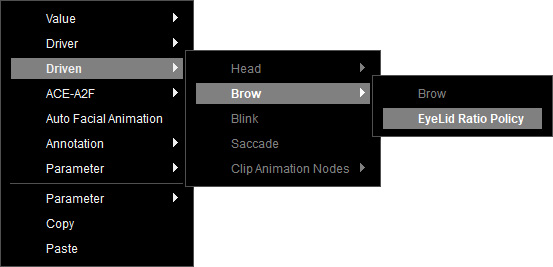
To create a Eyelid Ratio Policy node, right-click on the empty area of the graph, and select Driven > Brow > Eyelid Ratio Policy from the context menu.
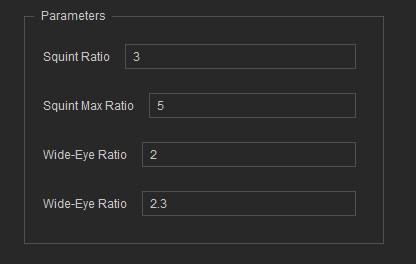
Select the node, and proceed to input values in the Parameters section.
Connect the Eyelid Ratio Policy node to the EyeLid Correlation input of the Brow node.
To create a Eyelid Ratio Policy node, right-click on the empty area of the graph, and select Driven > Brow > Eyelid Ratio Policy from the context menu.
Select the node, and proceed to input values in the Parameters section.
- Squint Ratio: Defines the ratio of eyelid squinting when the eyebrows lower.
Set a numeric value (in percentages) up to 2 decimal places in precision.
For example, set the value to 0.4, the eyelids will lower at 40% strength of the "Brow Drop". - Wide-Eye Ratio: Defines the ratio of eyelid widening when the eyebrows raise.
Set a numeric value (in percentages) up to 2 decimal places in precision.
For example, set the value to 0.8, the eyelids will raise at 80% strength of the "Brow Raise".
Connect the Eyelid Ratio Policy node to the EyeLid Correlation input of the Brow node.
Pitch: Perform Duration
Multiplies with the pitch duration to determine total duration.
An additional input when using Pitch animation trigger as driver.
It accepts values from the Float node.
To create a Float node, right-click on the empty area of the graph, and select Value > Float from the context menu.
Set a numeric value up to 2 decimal places in precision. Upon execution, the configured value will be transmitted to connected nodes.
Connect the Float node to the Pitch: Perform Duration input of the Brow node.
To create a Float node, right-click on the empty area of the graph, and select Value > Float from the context menu.
Set a numeric value up to 2 decimal places in precision. Upon execution, the configured value will be transmitted to connected nodes.
Connect the Float node to the Pitch: Perform Duration input of the Brow node.
Pitch: Morph Curve
Defines how pitch changes map to brow raise / lower intensity.
An additional input when using Pitch trigger to dynamically adjust the brow position in real time based on pitch variation.
It accepts an animation curve from the Curve (Two Way) node.
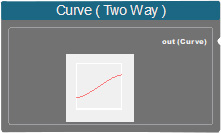
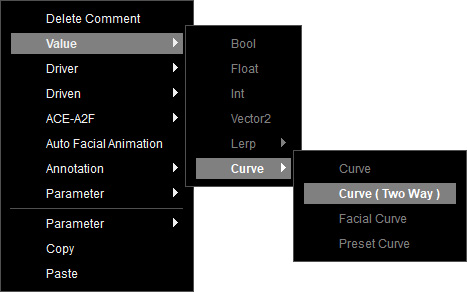
To create a Curve (Two Way) node, right-click on the empty area of the graph, and select Value > Curve > Curve (Two Way) from the context menu.
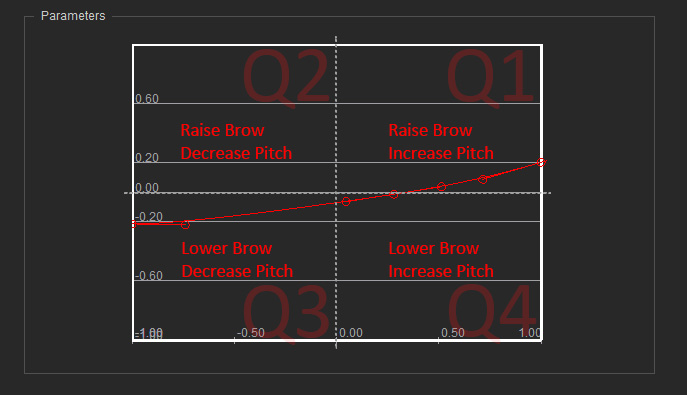
Select the node, and proceed to adjust the Bezier curve along the X and Y axes in the Parameters section. The positive or negative output value directly determines the brow animation: positive value raises the eyebrows, while a negative value lowers them.
Connect the Curve (Two Way) node to the Pitch: Morph Curve input of the Brow node.
To create a Curve (Two Way) node, right-click on the empty area of the graph, and select Value > Curve > Curve (Two Way) from the context menu.
Select the node, and proceed to adjust the Bezier curve along the X and Y axes in the Parameters section. The positive or negative output value directly determines the brow animation: positive value raises the eyebrows, while a negative value lowers them.
- Q1 (Top-right): X = Raise brow, Y = Increase pitch.
- Q2 (Top-left): X = Raise brow, Y = Decrease pitch.
- Q3 (Bottom-left): X = Lower brow, Y = Decrease pitch.
- Q4 (Bottom-right): X = Lower brow, Y = Increase pitch.
Connect the Curve (Two Way) node to the Pitch: Morph Curve input of the Brow node.
Pitch: Morph Ratio
A multiplier applied to the values from the Pitch: Morph Curve.
An additional input when using Pitch animation trigger as driver.
It accepts values from the Vector2 node.
To create a Vector2 node, right-click on the empty area of the graph, and select Value > Vector2 from the context menu.
Specify the value range by defining a low and high value in the node. This node accepts two numerical inputs and generates a random value within the defined range. Once executed, it transmits the randomly selected result to the connected node.
For example, if the value is set to 2, and the pitch curve yields brow raising at 50, the final output will be 100.
Connect the Vector2 node to the Pitch: Morph Ratio input of the Brow node.
To create a Vector2 node, right-click on the empty area of the graph, and select Value > Vector2 from the context menu.
Specify the value range by defining a low and high value in the node. This node accepts two numerical inputs and generates a random value within the defined range. Once executed, it transmits the randomly selected result to the connected node.
For example, if the value is set to 2, and the pitch curve yields brow raising at 50, the final output will be 100.
Connect the Vector2 node to the Pitch: Morph Ratio input of the Brow node.
Using Lerp
In additional to the values input from Vector2, you can use Lerp to design the range of random animations.
The Lerp (linear Interpolate) is a mathematical operation node to find an interpolated value between two inputs.
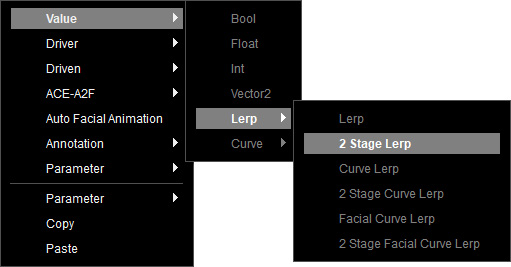
For example, create a 2 Stage Lerp node from the context menu Value > Lerp > 2 Stage Lerp to control the Stay Time.
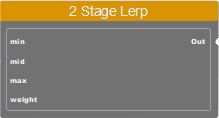
The 2 Stage Lerp node provides 3 input ports: min, mid and max for three different ranges, input from the Float or Vector2 node.
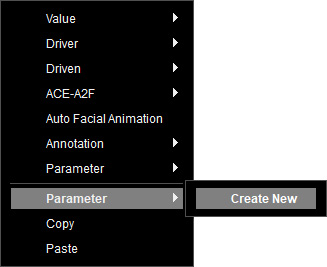
It requires a parameter node to control the weight for output. You can create one by right-clicking on the empty area of the graph, and selecting Parameter > Create New from the context menu.
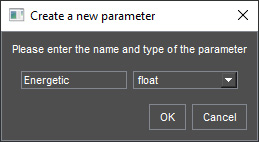
Name the new parameter and choose the float type. Click on OK.
Select this node to set a value ranging from 0 to 1 in the Variables section, to perform linear interpolation between the values from min to max. Once executed, the interpolated result is computed and sent to the connected nodes.
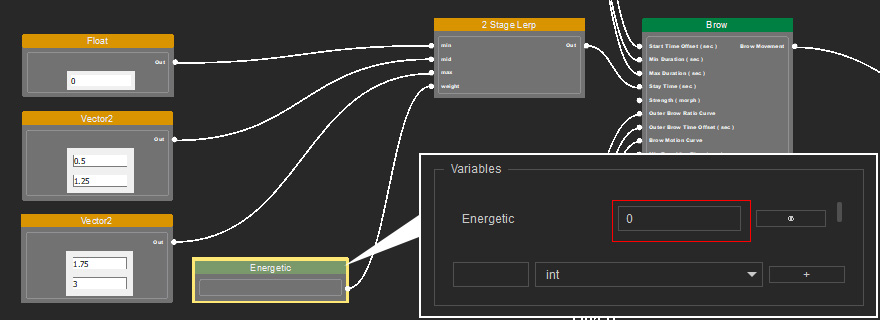
For example, create a 2 Stage Lerp node from the context menu Value > Lerp > 2 Stage Lerp to control the Stay Time.
The 2 Stage Lerp node provides 3 input ports: min, mid and max for three different ranges, input from the Float or Vector2 node.
It requires a parameter node to control the weight for output. You can create one by right-clicking on the empty area of the graph, and selecting Parameter > Create New from the context menu.
Name the new parameter and choose the float type. Click on OK.
Select this node to set a value ranging from 0 to 1 in the Variables section, to perform linear interpolation between the values from min to max. Once executed, the interpolated result is computed and sent to the connected nodes.
- If the value is set to 0, the result equals min.
- If the value is set to 0.5, the result equals mid.
- If the value is set to 1, the result equals max.
Make sure that the data are properly input in the Value nodes, before linking the Brow node to an animation trigger node.
