Designing Emotions
The AI Assistant can customize a character's facial expressions for up to 10 distinct emotions. These expressions can dynamically shift in intensity based on changes in volume during speech. You can design up to 3 expression morph keys per emotion, which correspond to neutral, normal, and emphasize intensity levels derived from the strength variation curve.
Follow the steps below to configure an emotion with 3 strength levels.
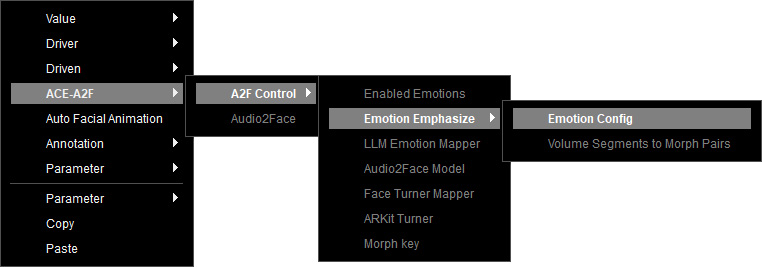
- Right-click on the empty area of the Speech graph, and select ACE-A2F > A2F Control > Emotion Emphasize > Emotion Config from the context menu.
- The Emotion Config node is created and lists the 10 identical emotions of the LLM.
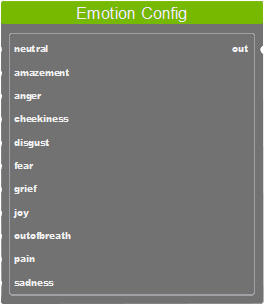
- Neutral
- Amazement
- Anger
- Cheekiness
- Disgust
- Fear
- Grief
- Joy
- Out of breath
- Pain
- Sadness
* If the sentence does not contain a Mood tag, or the LLM does not support prompt conditioning, the default emotion will be neutral. - Select the node to adjust the curve over volume in a Gaussian-based method with the sustain time, transition gap, merge gap, and sigma in the Parameters section.
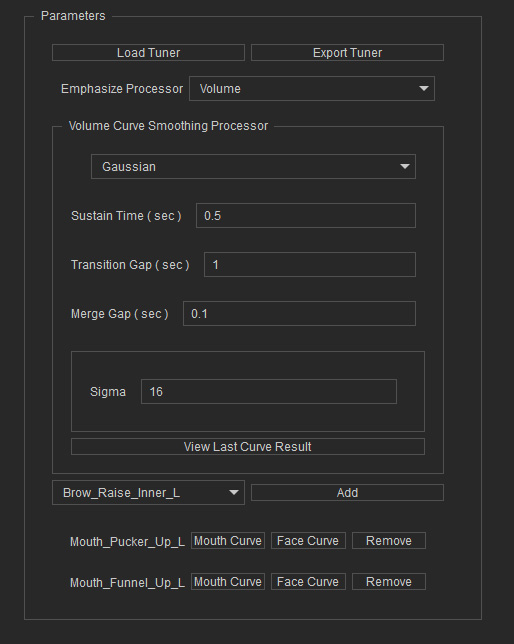
- Sustain Time: Defines how long the peak of a waveform lasts (in seconds).
- Transition Gap: Sets the minimum allowed time (in seconds) for the curve’s ascent and descent.
- Merge Gap: When two adjacent waveforms are below a certain threshold (in seconds), they are merged into a single average waveform.
- Sigma: Controls the Gaussian smoothing intensity applied to the volume waveform in a float value, suggested between 15 to 30. The higher value, the stronger smoothing. Stronger smoothing makes the waveform closer to a flat line; on the contrary, waveform remains closer to the original audio shape.
- Each time the character speaks, the volume curve will smooth out according to the Gaussian operations.
You can view this curve by clicking the View Last Curve Result button after the character speaks.
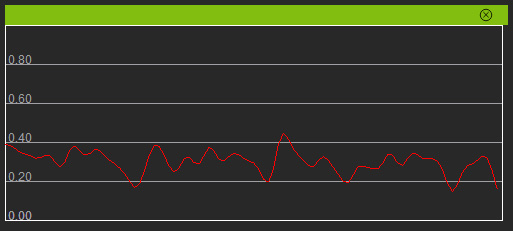
- The x-axis represents the timeline for speech tracking.
- The y-axis represents the volume in 0.01 decibels.
- You can also select a morph from the drop-down list and click on Add to modify its Mouth Curve and Face Curve separately in the Constraint mapper.
The two curves are used to constrain the emotion intensity on the mouth and other facial area respectively.
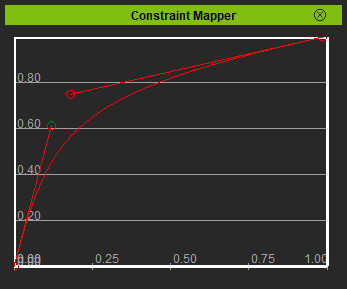
- The x-axis represents the morph strength on the character.
- The y-axis represents the constraint ratio. The stronger the value, the lower the emotion intensity will be. 0 means that the emotion will be completely layered on, while 1 means no emotion will be added on.
Splitting Volume into Segments
Split the character's volume curve into 3 intensity levels to design a strength variation curve for each emotion.
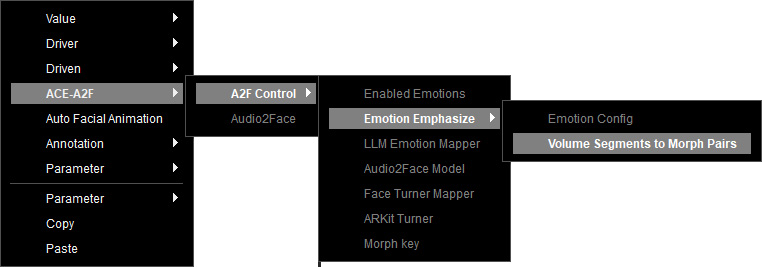
- Right-click on the empty area of the graph, and select ACE-A2F > A2F Control > Emotion Emphasize > Volume Segments to Morph Pairs from the context menu.
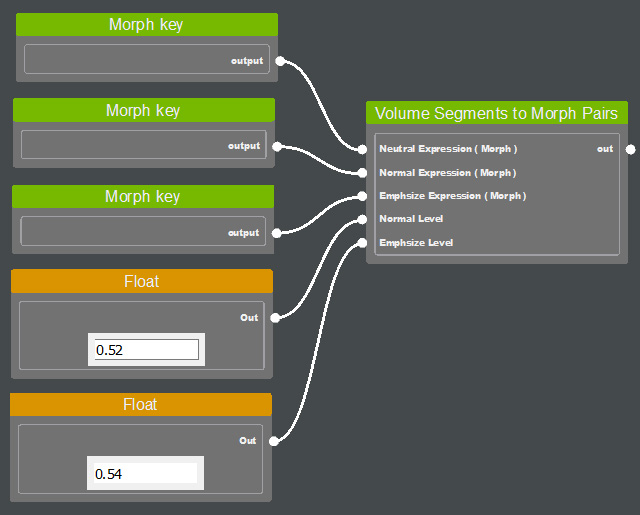
- The Volume Segments to Morph Pairs node is created and lists the available 3 intensity levels: neutral, normal, and emphasize (ordered by volume level).
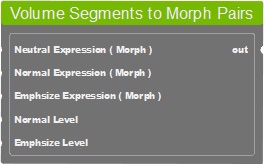
The 3 expression levels represent the different stages of one emotion divided by volume. For example, the results of "Joy" may be: a smile at neutral, a stronger smile at normal, and a smile plus cheek lift at emphasize.- Neutral Expression for an emotion at the lowest volume, or without sound, such as breathing, before and after speaking, etc.
- Normal Expression for an emotion at the normal volume during speech.
- Emphasize Expression for an emotion when the volume exceeds a certain value.
The 2 levels splits the character's volume curve into 3 horizontal blocks (that is, 3 decibel levels). These 3 levels will correspond to the neutral, normal, and emphasize.- Normal Level segments the character's volume curve into Neutral and Normal intensity levels based on a decibel threshold.
- Emphasize Level segments the character's volume curve into Normal and Emphasize intensity levels based on a decibel threshold.
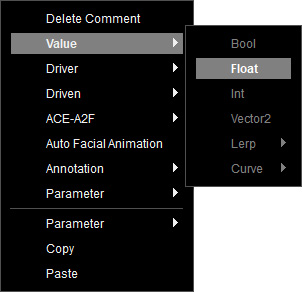
- Create a Float node by right-clicking on the empty area of the graph, and select Value > Float from the context menu.
- Set a numeric value up to 2 decimal places in precision (in 0.01 decibels) in the Float node to define the threshold levels between curve segments based on the character's volume intensity range.
Then connect the Float nodes respectively to the Normal Level and Emphasize Level input of the Volume Segments to Morph Pairs node.
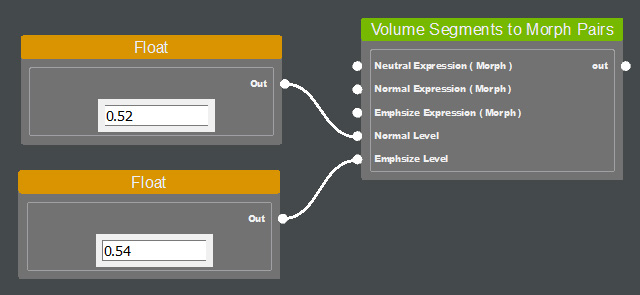
For example, set one Float value to 0.52 for the Normal Level, and the other to 0.54 for the Emphasize Level.- When the character's volume reaches 52 dB, the intensity curve transitions from Neutral level to Normal level.
- When the character's volume reaches 54 dB, the intensity curve transitions from Normal level to Emphasize level.
- If the value is set to 0, the result equals min.
- If the value is set to 0.5, the result is the average of min and max.
- If the value is set to 1, the result equals max.
 Using Lerp
In additional to the values input from Float, you can use Lerp to design the range of random animations and to find an interpolated value between two inputs.
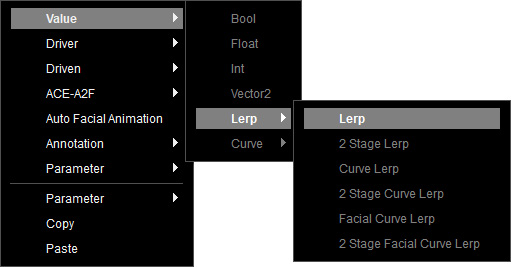
For example, create a Lerp node from the context menu Value > Lerp > Lerp to control the decibel thresholds.
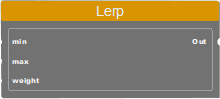
The Lerp node provides 2 input ports: min and max for two different ranges, input from the Float or Vector2 node.
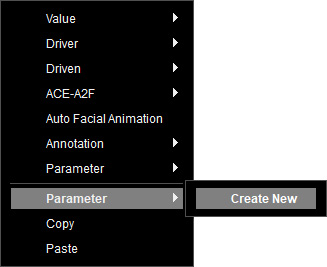
A parameter node is required to control the weight for output. You can create one by right-clicking on the empty area of the graph, and selecting Parameter > Create New from the context menu.
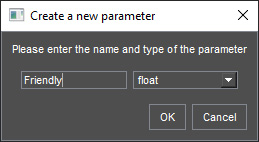
Name the new parameter and choose the float type. Click on OK.
Select this node to set a value ranging from 0 to 1 in the Variables section, to perform linear interpolation between the values from min and max. Once executed, the interpolated result is computed and sent to the connected nodes.
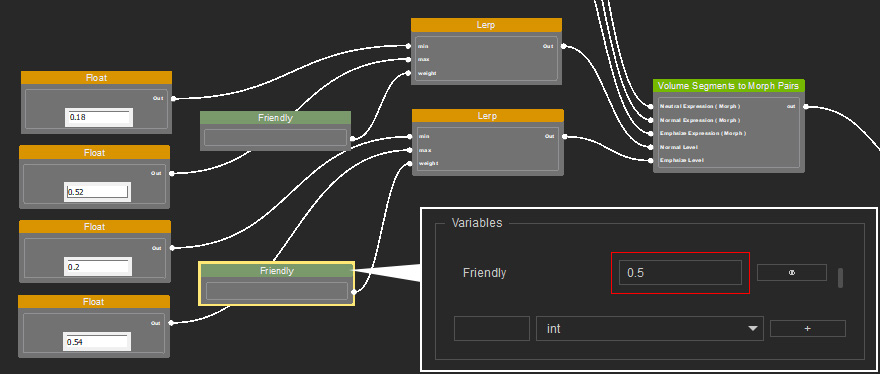
For example, create a Lerp node from the context menu Value > Lerp > Lerp to control the decibel thresholds.
The Lerp node provides 2 input ports: min and max for two different ranges, input from the Float or Vector2 node.
A parameter node is required to control the weight for output. You can create one by right-clicking on the empty area of the graph, and selecting Parameter > Create New from the context menu.
Name the new parameter and choose the float type. Click on OK.
Select this node to set a value ranging from 0 to 1 in the Variables section, to perform linear interpolation between the values from min and max. Once executed, the interpolated result is computed and sent to the connected nodes.
Designing the Emotion Visuals
You can design the expression on each intensity level with a Morph Key node.
- To create a Morph Key node, right-click on the empty area of the graph, and select ACE-A2F > A2F Control > Morph Key from the context menu.
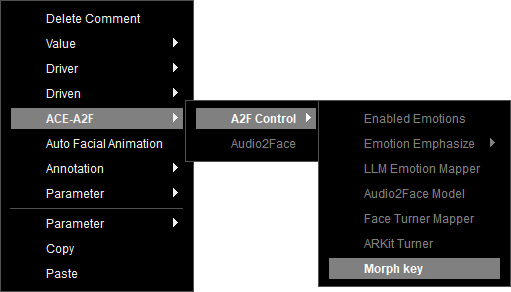
- Select the created node, and modify the available morphs on the character in the Parameters sections.
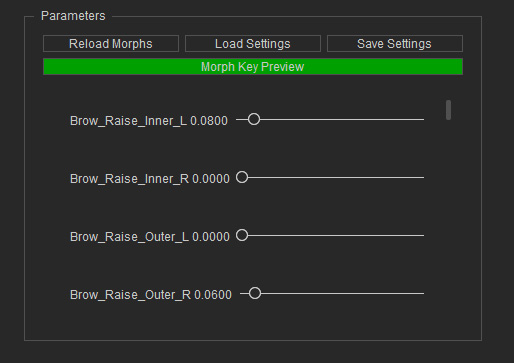
* When dragging the morph sliders, you can press down the Morph Key Preview button under the Preview mode (from the main panel) for real-time results.
* When the character changes, click the Reload Morphs button to load available morphs for the new character. - Click on Save Settings to save the morph configurations as a preset in JSON format. You can then import the saved preset by clicking the Load Settings button anytime.
- Connect the Morph Key nodes respectively to the Neutral Expression, Normal Expression and Emphasize Expression inputs of the Volume Segments to Morph Pairs node.
- Connect the Volume Segments to Morph Pairs node to each emotion input of the Emotion Config node.
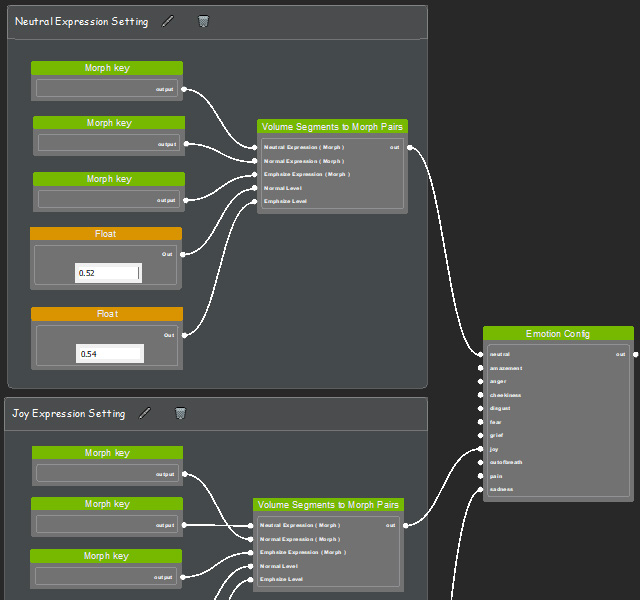
- Finally, connect the Emotion Config node to the namesake input of the Audio2Face node.
